Mathematics of the brain: a NeuroMat op-ed
Jul 31, 2018
by Antonio Galves*
To begin with: what does Mathematics have to do with Brain Biology?
The answer is based on a single claim: Biology does not currently have a conceptual framework to rigorously formulate the phenomena associated with brain functioning observed experimentally.
My article has barely begun and I can already hear shouts of indignation from my esteemed colleagues from Neurobiology.
How so Biology does not have a conceptual framework to study brain functioning?! This is a typical arrogant claim from a mathematician who thinks that outside Mathematics there is no scientific hope! What are we talking about?
An example will help understand what I mean and bring the discussion with biologists to a less conflictive level.
I will introduce an experimental protocol involving electro-encephalography which is one of the simplest non-invasive ways of studying brain functioning.
An experimental protocol
The experimental protocol consists of displaying two films to volunteers.
The first movie shows a human being walking. To prevent details of the physical appearance of the walker from attracting the viewer's attention, the image is limited to a set of luminous markers, indicating the hinges of the walker's arms, legs, hands, feet and head. The walker is filmed walking on a treadmill, so that his image is always in the center of the screen.
The second movie shows exactly the same sequence of images, but depicts a "scrambled" version of dots on the screen. Thus, for instance, points corresponding to the right arm appear in the position corresponding to the head, the head is moved to the foot position, etc. This "scrambling" of dots makes the second film totally incomprehensible to the viewer.
In the first movie, the set of dots clearly shows someone walking; in the second movie, there is some uneasiness, as no obvious meaning can come up from the sequence of images.
It is natural to propose the conjecture that the fast identification of the image of a walker in the first film, as opposed to the uneasiness that the sequence of shuffled images sparks, will lead to a distinct brain functioning. To recognize a known movement should require from the viewer's brain an activity very different from that required by the second movie, in which the viewer is forced to make an unsuccessful effort to making sense to the incomprehensible sequence of observed images.
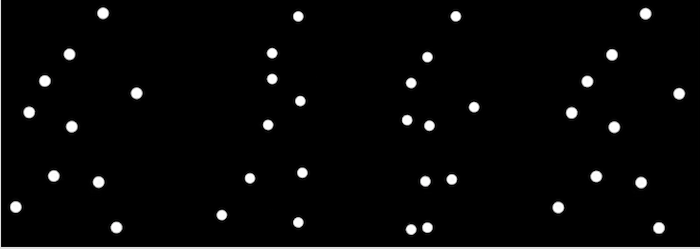 |
| Successive frames of the movie showing the walker, indicated by luminous dots indicating the points of articulation of a body | Fraiman et al. (2014) |
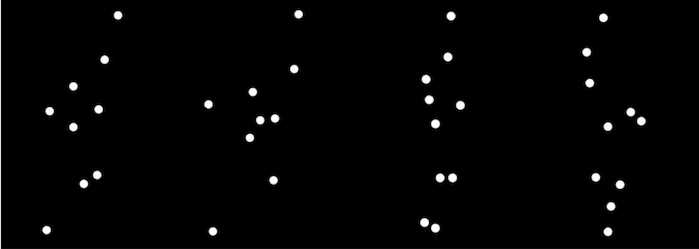 |
| Successive frames with scrambled articulation dots | Fraiman et al. (2014) |
Looking for characteristic features
Would it be possible to characterize accurately the distinctive features of brain functioning of a spectator in front of the two movies?
To try to answer this question, electro-encephalographic records were made with many volunteers as they watched the two movies.
The basic question is whether or not we can identify in the electro-encephalographic records the features that characterize the differences in brain functioning of the viewer of each of the movies.
The characteristic features we are looking for are not self-evident when we first examine the electro-encephalographic records. We are dealing with "drawings," describing the activity of populations of neurons, and these drawings seem to vary disorderly over time. Even worse, the recordings of two different viewers watching the same movie seem at first glance to be totally different. Even worser, records made on two different occasions with the same viewer watching the same movie seem to be totally different!
How do you find some characteristic feature in such variable recordings?! How to find regularities in this apparent disorder?
This is the issue to be discuss in this text.
What Gromov tells us
Before answering, it is relevant to quote a phrase from the great mathematician Mikhail Gromov. He said that the task of Mathematics and mathematicians was to find regularities that were not perceptible to the naked eye. I quote from memory, translating it freely from English.
Following Gromov's statement, we may wonder how Mathematics can help us find regularities in these drawings from the electro-encephalographic recordings.
Correlations and graphs
A first idea is to describe how the signals recorded on each pair of electrodes are correlated with each other. The intuition behind this idea follows. We can conjecture that something that distinguishes brain functioning from the two films is the set of regions involved in processing the sequence of images. Perhaps the understanding of each of the two movies requires the viewer to simultaneously use different regions of the brain. This information about the simultaneous use of distinct regions may perhaps be retrieved if we study how the signals recorded by the various electrodes correlate.
The notion of correlation is a simple mathematical notion and can be explained informally. We will do this using an example from football.
Suppose we are watching the spectators of a football game. If we look at two fans of the same team, we will see that they have very similar reactions during the match. When one of them shouts happy: Score!, the other also shouts: Score! And we understand that both are reacting to a goal from the team they support. When one of them makes a gesture of discouragement, or irritation, the other will also make this gesture, and we will understand that their team missed a good opportunity. In technical terms, we will say that the behavioral recordings of the two fans are positively correlated when their behaviors are of the same type.
It is also clear that the behavioral evolutions of two supporters of different team are negatively correlated. A goal from a team is celebrated by its fans, at the same time as it is lamented by the fans of the other team.
There is also the case of a spectator who does not love football, has no interest in the game that is unfolding and is in the stadium for reasons that do no pertain to football, for example to be with his girlfriend who is a fanatical supporter of one of the teams. This disinterested spectator will tend to be annoyed and behave in a way that has nothing to do with the game. The behavior of this disinterested spectator is not correlated neither positively nor negatively with the behavior of a supporter of one of the two teams that are playing on the field.
Correlation between pairs of electro-encephalographic records
Let us now apply the same notion of correlation to study the evolutions of the electro-encephalographic signals recorded in pairs of electrodes.
An electro-encephalographic record describes the evolution of brain activity over time in a particular region of the brain. This record indicates moments of more intense activity and others of less activity. Signals recorded on two electrodes are correlated if the intensity of activity recorded in one of them at a given time interval gives an indication of the activity recorded on the other electrode. In particular, activities are "positively correlated" if the activities recorded in the two have periods of intense activity at the same time. Exactly as it happens with the evolutions of the behaviors of two fans of the same team watching a game.
Signals recorded on two electrodes are "negatively correlated" if, on the contrary, periods of intense activity recorded on one electrode coincide with periods of low activity in the signal recorded on the other electrode. Just as it happens when we follow the simultaneous reactions of opposing team supporters.
Finally there are pairs of electrodes whose signals, recorded during the display of the films, are neither positively nor negatively correlated. In other words, the signals recorded on the two electrodes suggest that we are facing independent neuronal activities. Just as it happens when we compare the behaviors of a supporter and that of a spectator who went to the stadium for reasons that do not pertain to football, without being interested in the game being played.
The statistic that allows us to "estimate" the correlation between two evolutions will give us a real number, positive if the correlation is positive, or negative if it is negative. We will apply this formula, this "statistic", to the recorded signals while the voluntary spectators were watching the two films.
The notions of correlation of Pearson and Spearman
This text is not the appropriate place to present formal definitions and mathematical formulas. In any basic statistical text or Wikipedia, the interested reader can easily find the formula for calculating Pearson's correlation coefficient, which introduced the notion in the early twentieth century. You can also find the associated notion of "Spearman's correlation coefficient" which was the measure actually used in the scientific work that I am informally describing in this text.
A graphical representation
Let us represent in a graph the system of electrode pairs, indicating pairs that recorded correlated evolutions, positively or negatively, and pairs that recorded uncorrelated activities.
To make this graphical representation you must set a threshold, a cut-off value. We say that two electrodes are correlated over a certain time interval if the absolute value of the correlation measured empirically in that time interval is greater than the cut-off value. Alternatively we will say that they are not correlated in that time interval if the absolute value of the empirically measured correlation is smaller than the cut-off point.
The representation we get is what is called a graph. A graph is a mathematical object. It is formed by a set of vertices and by a set of edges. The edges are indicated by their extremities which are two distinct vertices.
In our case, the vertices correspond to the set of electrodes and the edges will indicate the pairs of electrodes that recorded correlated signals during the interval of time we are considering. We will do this by trimming the total interval of the experiment at successive intervals of the same length, measuring the correlation between the signals recorded at each electrode pair at that time interval and finally drawing a graph for each of the intervals, indicating the pairs of electrodes whose registers have a correlation whose absolute value is higher than the cut-off value.
A synthetic look at the electro-encephalographic records
This mathematical representation allows us to have a synthetic look at the total set of electro-encephalographic records. We now have before our eyes a sequence of graphs, indicating how the pairs of electrodes that were correlated during the experiment have evolved. This representation is much simpler than the original drawings. And in fact this summarized representation in the form of a sequence of graphs allowed us to identify an important difference in the records that were made while the spectator watched the movie of a walker and the movie with shuffled images.
Where the two graph sequences differ
The difference found is as follows. One of the vertices of the graphs that were estimated from successive time intervals received systematically more edges during the display of the movie with scrambled images in comparison to the edges it received when the film with normal images was played. This distinctive behavior was recorded at the vertex corresponding to the electrode F7, which is located in the prefrontal region.
In other experiments, the electrode F7 had already been identified as associated with an activity of recognition of "natural" animated images, images of animals, images of men. Thus, the result described above somehow "corroborates" previous results, identifying the region recorded by the electrode F7 as the one that attempts to assign meaning to an incomprehensible sequence of scrambled images --scrambled images to which the viewer cannot assign a "natural" sense. This happens as if the difficulty in assigning a "natural" sense to the images of the shuffled film required an intense performance from the brain, simultaneously involving the region recorded by the electrode F7 and several other regions of the brain. It is this simultaneous action that makes the electrode F7 appear with more edges in the case of the scrambled film than in the case of film with day-to-day images of someone walking.
A little joke with the graphs will perhaps help you understand what is possibly happening. Everything happens as if in the effort to understand the scrambled images the region recorded by the electrode F7 had to ask several other regions whether or not they were making sense of what was being displayed.
What is this, what is this ?! Are you getting these strange images? --the electrode-F7 region might be asking other regions.
This imaginary dialogue between regions of the brain is of course just anecdotal, a means of illustrating the researchers' intuition about the difference found in the graphs. The fact is that watching a movie with scrambled images was translated into electro-encephalographic records with a behavior involving simultaneously more regions of the brain.
New protests from neurobiologists
Now,, a chorus of esteemed neurobiological colleagues goes back with satisfaction to the controversy that arose in the first lines of this text.
The work that was reported informally above illustrates well that neurobiologists can deal very satisfactorily with complex brain functions without having to wait for mathematicians to go down from the Olympus with new mathematical objects.
My neurobiologist friends continue:
It is evident that in this article mathematical or statistical notions are used, but all of them are already part of the common knowledge of a well trained scientist. For example, Pearson and Spearman correlation coefficients were introduced more than 100 years ago. The notion of a random graph was introduced by Gilbert, Erdös and Rényi more than 50 years ago. These are tools that all neurobiologists have control of and use. We do not why it is necessary to create new mathematical objects as claimed in this article.
And now, how to respond to this objection?
The need for new mathematical objects
The answer is simple. Let's go back to the work I reported informally above. This work brilliantly identifies a difference between the graphs recorded during the display of the two films. This result undoubtedly shows that a team of high-level neurobiologists can extract as much information as possible from experimental data using tools that are already accessible. The choir of neurobiologists is right.
However, the happy ending obtained in this beautiful article is not really the end of the story. We're just seeing the tip of the iceberg. The data still has an immense amount of information to reveal. I will explain my point.
It is natural to conjecture that, despite an apparent diversity, the sequences of graphs that were recorded from several viewers watching the movie showing a walker have common features that distinguish them from the sequences recorded from viewers watching the film with baffled images. However, in our current state of research, we do not know what these distinctive common features are when we compare the sequences of graphs recorded for each movie.
The fact is that there is currently no conceptual framework that allows us to formulate precisely this question. However, the path we must follow to create this new conceptual framework is clear. I will outline it below.
Modeling random evolutions
To start, we ought to define a class of mathematical models describing random evolutions taking up values on the graph space. The notion of random evolution is classical in a subfield of Mathematics called Probability Theory. Random evolutions are modeled by mathematical objects called Stochastic Processes.
One of the first stochastic processes studied from a mathematical point of view described the movement of a grain of pollen in a drop of water observed through a microscope. This Stochastic Process was called the Brownian Movement in honor of the botanist Robert Brown who in 1827 made the first description of some of the visible features of the movement of the pollen grain. For example, he noted that the grain was moving continuously and that its trajectory "changed direction" with each step. In 1905 the physicist Albert Einstein proposed a precise formula for the probability distribution governing the displacement in the space of the grain of pollen after a certain interval of time. Later, in 1923, the mathematician Norbert Wiener worked on a mathematical object that was rigorously constructed having the characteristics described by Brown and having the probability distribution indicated by Einstein. And this is one of the starting points of modern Probability Theory, perhaps the most dynamic branch of present-day Mathematics.
We must now define a new class of Stochastic Processes capable of representing the observed sequences of graphs from the electro-encephalographic records made while the spectators watched the two films. This is the first step of the path we must follow.
The second step is to find statistical criteria capable of identifying in the new class of Stochastic Processes the class in terms of greater economy better adjust to the data. This is the work road that we will have to follow to continue the research described above, raising it to another level.
Antonio Galves is the director of the RIDC NeuroMat. This piece was originally published in Portuguese at the Blog "Ciência e Matemática" at O Globo, on July 11, 2018. The derivative publication is authorized by the publisher.
Notes:
-
The work described above was done within the framework of the NeuroMat project by the team led by neurobiologist Claudia D. Vargas, from UFRJ. This work gave rise to the article FRAIMAN, D. et al. Biological motion coding in the brain: analysis of visually driven EEG functional networks. PLoS One. 9, n. 1. jan. 2014. It can be downloaded at: http://journals.plos.org/plosone/article?id=10.1371/journal.pone.0084612
-
The film Conexões Dinâmicas, produced by Pesquisa FAPESP, illustrates the article by Fraiman et al. (2014). This movie can be downloaded from the website http://revistapesquisa.fapesp.br/2014/07/16/conexoes-dinamicas-2/
This piece is part of NeuroMat's Newsletter #54. Read more here
Share on Twitter Share on Facebook| NeuroCineMat |
|---|
|
Featuring this week: |
| Newsletter |
|---|
|
Stay informed on our latest news! |
| Follow Us on Facebook |
|---|
| Podcast A Matemática do Cérebro |
|---|
|
| NeuroMat Brachial Plexus Injury Initiative |
|---|

|
| Neuroscience Experiments System |
|---|
|
| NeuroMat Parkinson Network |
|---|

|
| NeuroMat's scientific-dissemination blog |
|---|
|
|